728x90
# 어떤것을 많이 틀리는지 확인한다.
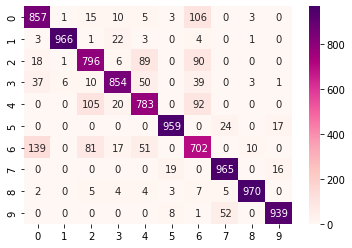
# 이런것은 컨퓨전 매트릭스로 확인하는 것!
from sklearn.metrics import confusion_matrix
y_pred = model.predict(X_test)

y_pred.shape # 테스트 이미자가 10000개
(10000, 10) # 출력

y_test[0]
9 #출력

y_pred[0]
# 출력
array([4.27080568e-06, 1.02400215e-07, 6.76651825e-06, 5.95587892e-07,
       2.32840534e-06, 1.21201472e-02, 4.48114770e-06, 1.23955883e-01,
       3.06501424e-05, 8.63874733e-01], dtype=float32)

y_pred[0].argmax()
9 #출력 예측결과와 y_test 비교
y_pred_labels = y_pred.argmax(axis=1)
y_pred_labels
array([9, 2, 1, ..., 8, 1, 5]) # 출력
y_test
array([9, 2, 1, ..., 8, 1, 5], dtype=uint8) # 출력
# confusion_matrix 가 이제 가능하다.
cm = confusion_matrix(y_test, y_pred_labels)
cm
# 출력
array([[857, 1, 15, 10, 5, 3, 106, 0, 3, 0],
[ 3, 966, 1, 22, 3, 0, 4, 0, 1, 0],
[ 18, 1, 796, 6, 89, 0, 90, 0, 0, 0],
[ 37, 6, 10, 854, 50, 0, 39, 0, 3, 1],
[ 0, 0, 105, 20, 783, 0, 92, 0, 0, 0],
[ 0, 0, 0, 0, 0, 959, 0, 24, 0, 17],
[139, 0, 81, 17, 51, 0, 702, 0, 10, 0],
[ 0, 0, 0, 0, 0, 19, 0, 965, 0, 16],
[ 2, 0, 5, 4, 4, 3, 7, 5, 970, 0],
[ 0, 0, 0, 0, 0, 8, 1, 52, 0, 939]])import seaborn as sb
sb.heatmap(data=cm, annot=True,fmt='.0f',cmap='RdPu')
plt.show()
'Python' 카테고리의 다른 글
| 파이썬으로 압축 파일 푸는 방법, zipfile (0) | 2021.12.02 |
|---|---|
| 이미지 파일 (JPG, PNG..)을 학습을 위해 넘파이 데이터로 만드는 방법(ImageDataGenerator) (0) | 2021.12.02 |
| 뉴럴넷에 이미지를 학습시킬때, 텐서플로우로 사용하는 코드 (0) | 2021.12.01 |
| 이미지를 피처 스케일링 하는 방법 (0) | 2021.12.01 |
| 이미지의 행렬, Gray Scale Image. Color Image (0) | 2021.12.01 |